Setting up Octave for OS X Terminal
I started taking the Machine Learning class on Coursera and so far it is awesome. In Week 2, students get introduced to Matlab and Octave. While Matlab is super smooth to use, Octave is unfortunately not.
I am not talking about Octave itself, I am talking about the Octave GUI.
The instructor, Andrew Ng, uses his Windows command line during the course, but following this in the provided Octave GUI feels strange.
Intuitively, I tried to navigate my input using the left and right arrow keys, but the GUI does not support this. The same applies to the up and down arrow keys, which I expected to let me browse command history, like we all know from our terminal or command line. To put it in a nutshell, the user experience is not optimal.
The problem is known and bug reports can be found online.
After spending some time looking for a simple way to use Octave with my OS X Terminal, I decided to publish this short tutorial.
Install dependencies
Open your terminal and type in the following:
# Install Homebrew (if needed)
ruby -e "$(curl -fsSL https://raw.githubusercontent.com/Homebrew/install/master/install)"

# Tap science formulae
brew tap homebrew/science

# Check for updates (skip this if Homebrew was just installed)
brew update && brew upgrade

# Install gfortran
brew install gfortran

# If you see:
# "GNU Fortran is now provided as part of GCC"
brew install gcc

# Install Octave (can take a few minutes)
brew install octave

# Install gnuplot
brew install gnuplot --with-qt
Configure Octave defaults
Open a new terminal window and navigate to your home directory. Create .octaverc and open it:
cd ~
touch .octaverc
open .octaverc
Now add global Octave settings in that file:
setenv ("GNUTERM", "qt")

# Optional: shorten the prompt
PS1('>> ')
There are some blog posts out there about setting up Octave for OS X Terminal, but the main obstacle for me was that they use X11 as a gnuplot terminal, which was not working on my machine. When I changed this to qt, I was suddenly able to generate plots.
Test your setup
Open a new terminal window and run:
t = [0:0.01:0.98];
y = sin(2*pi*4*t);
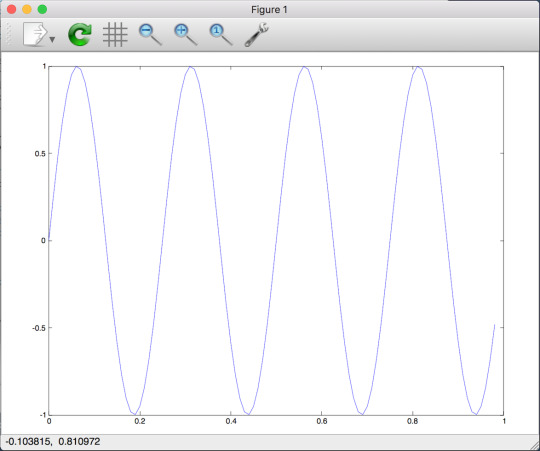
plot(t,y)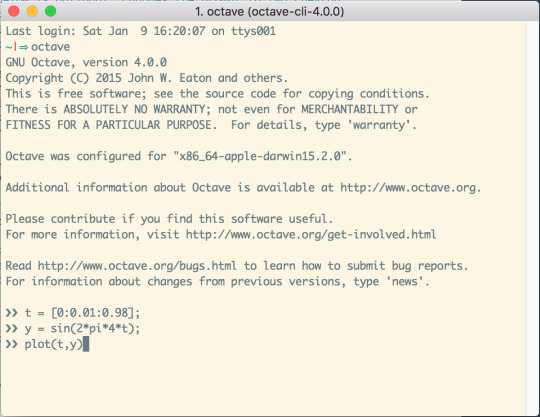
By executing plot(), a new window should open and show this graph:
Let me know if I forgot something or if you found mistakes in my explanation. Have fun using Octave from your terminal, and keep up with the Machine Learning class.